Traders are constantly searching for strategies to enhance their decision-making in stock markets. One of the most widespread approaches is technical analysis. But how can it be effectively applied to trading, especially in volatile markets? Can understanding historical data and price movements improve the odds of success?
For those venturing into nifty futures, technical analysis can offer valuable insights. By studying past price behavior, traders can make more informed predictions about future market movements. This method is particularly helpful when identifying trends, spotting patterns, and planning entry or exit points in the market.
The Importance of Analyzing Data’s History
The technical analysis revolves around the principle that past market behavior can offer clues about future price movements. Unlike fundamental analysis, which focuses on a company’s financials, technical analysis primarily concerns charts, patterns, and statistical indicators. By looking at historical data, traders can assess the overall trend and predict potential market shifts.
For those trading in nifty futures, using historical data allows a better understanding of how the market reacts under specific conditions. Traders can identify recurring patterns and use them to their advantage when deciding to buy or sell positions.
Using Moving Averages in Technical Analysis
Moving averages are a staple in technical analysis because they smooth out price data to help traders identify the market’s direction. This indicator clearly shows whether the market is in an uptrend, downtrend, or sideways movement. There are two main types of moving averages that traders use:
- Simple Moving Average (SMA): This is calculated by averaging a set number of past price points. It helps determine the overall trend without catching up in short-term market fluctuations.
- Exponential Moving Average (EMA): This type weighs recent price data more heavily, making it more sensitive to current price movements. It is often used by traders who want quicker signals.
The Role of Volume in Technical Analysis
Volume is often considered a confirming indicator in technical analysis. It refers to the number of shares or contracts traded in a certain security. When combined with price movements, volume can offer insights into the strength or weakness of a trend.
For traders involved in nifty futures, monitoring volume can enhance the accuracy of predictions, allowing them to make more informed decisions and reduce potential losses.
A rising price accompanied by high volume is generally a strong signal that the trend will continue. Conversely, if the price rises but the volume decreases, it may suggest that the trend is losing momentum and could soon reverse.
Practical Application of Technical Analysis
Technical analysis offers many tools that can help traders make more calculated decisions. However, applying these tools correctly is essential to maximize their effectiveness. While technical analysis does not guarantee success, it equips traders with tools to make informed decisions in nifty futures trading. Here are some ways technical analysis can be put to use:
- Timing entries and exits: By recognizing trends and patterns, traders can determine the best time to enter or exit the market.
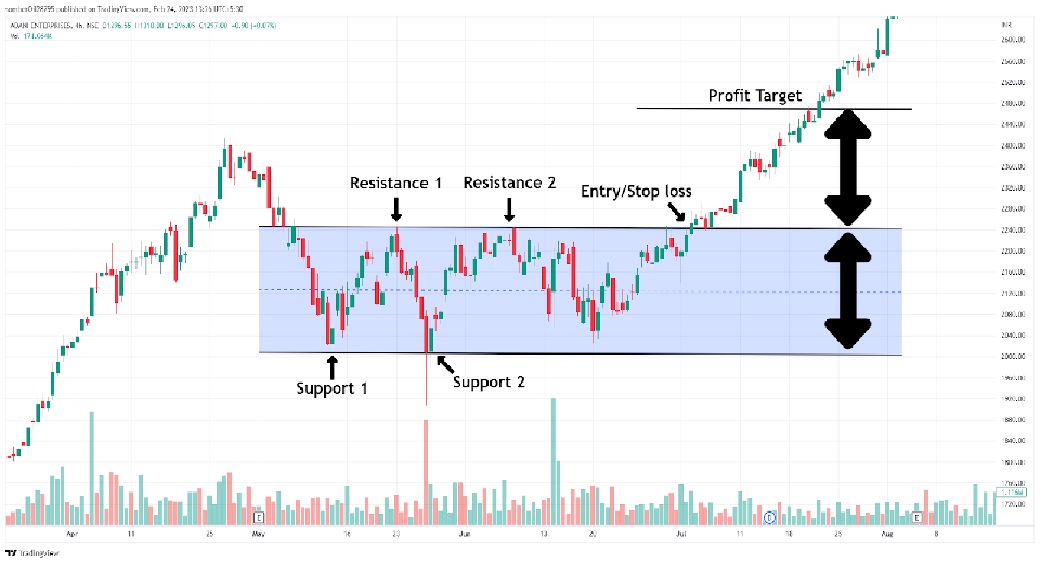
- Managing risks: Identifying key levels like support and resistance allows traders to set stop-losses effectively, limiting potential losses.
- Confirming trends: Traders can confirm whether a market trend is likely to continue or reverse using indicators such as moving averages and volume.
Incorporating technical analysis into a nifty futures trading strategy can significantly improve decision-making. By focusing, traders can gain a clearer view of potential market trends through all the above aspects. Trading coaches allow for better planning and a more structured way of navigating the complexities of the financial market